Visualizing Nginx logs with GoAccess
Published on
Updated on
I currently use Ackee to collect minimal analytics on this website. That comes as an additional Javascript library which has its own set of possible issues:
- Doesn’t count visits with javascript disabled
- Some visitors may block the API
On the other hand, nginx which is my webserver of choice comes with the capability of logging requests. In fact, when setting it up as a podman/docker container, it already is configured to do so.
Configuring nginx
To see where it’s configured within the container, take a look at /config/nginx/nginx.conf
access_log /config/log/nginx/access.log;
If it’s not already there, you can add it to configure logging. In fact, you can also change the logging location, however, the rest of this post will assume the one listed.
If we’re using nginx within a container, then we’ll need a volume mount to keep the log data persistent. Here is how we do it via docker-compose.
nginx:
  # Other attributes
  volumes:
    # Other volume mounts
    - /var/log/nginx:/config/log/nginx
Within the container, the logs are stored in /config/log/nginx. This configuration then maps it so it shows up at /var/log/nginx on the host system.
Okay so we are now logging to access.log, how do these logs look like? By default it looks like the following:
60.37.199.123 - - [27/Nov/2022:02:04:44 -0500] "GET /offline HTTP/2.0" 301 162 "https://brandonrozek.com/serviceworker.js" "Mozilla/5.0 (Windows NT 6.3; Win64; x64) AppleWebKit/537.36 (KHTML, like Gecko) HeadlessChrome/87.0.4280.141 Safari/537.36 Edg/87.0.664.75"
60.37.199.123 - - [27/Nov/2022:02:04:44 -0500] "GET /offline HTTP/2.0" 301 162 "https://brandonrozek.com/serviceworker.js" "Mozilla/5.0 (Windows NT 6.3; Win64; x64) AppleWebKit/537.36 (KHTML, like Gecko) HeadlessChrome/87.0.4280.141 Safari/537.36 Edg/87.0.664.75"
Now it’s difficult to parse a log file filled with entries like this. This is where GoAccess comes to play.
GoAccess
GoAccess is a real-time web log analyzer which displays in both a terminal and browser visitor metrics.
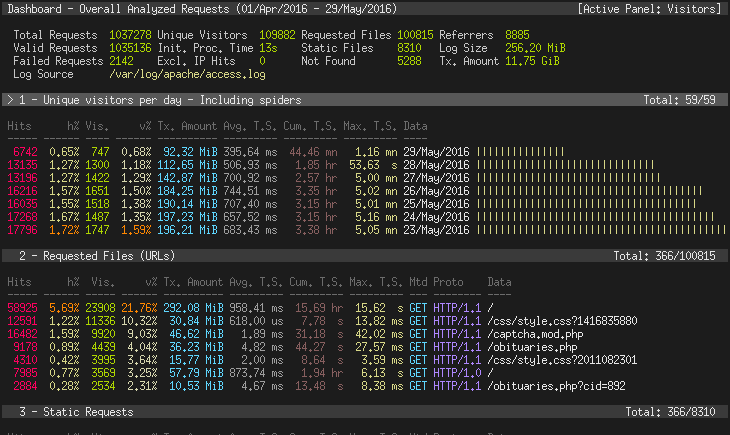
I’ve been running it for the past week, and there’s a section where it displays pages that are 404ing.
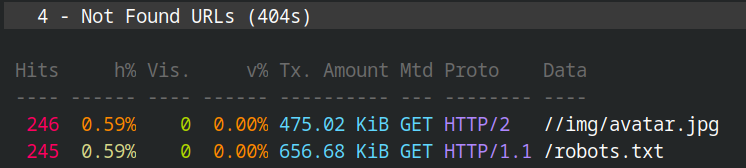
This has inspired me to fix my theme and upload a robots.txt!
By default, GoAccess is not a daemon, and will start by parsing the log file at its current point. To start it, all you need to specify is the location of the log file.
goaccess /var/log/nginx/access.log
Then, it will ask you some questions about the type of log that it’s parsing. To save those options permanently, we’ll need to edit /etc/goaccess/goaccess.conf.
These are the settings for the default nginx log type.
log-file /var/log/nginx/access.log

time-format %H:%M:%S
date-format %d/%b/%Y

# NCSA Combined Log Format
log-format %h %^[%d:%t %^] "%r" %s %b "%R" "%u"
Other options to consider:
# Prompt log/date configuration window on program start.
config-dialog false

# Color highlight active panel.
hl-header true

# Ignore request's query string.
# i.e.,  www.google.com/page.htm?query => www.google.com/page.htm
#
# Note: Removing the query string can greatly decrease memory
# consumption, especially on timestamped requests.
no-query-string true
Pros/Cons to Log Analyzing
Pros:
- No database to manage
- No extra software to install
- No javascript dependency
Cons:
- Bot traffic may overshadow regular visitors
- More complex logging behavior can’t be replicated
- Though from a human privacy standpoint, this is a good thing :)
Things to look at later
I’ve been only using GoAccess for the past week now, and there are still many features that I haven’t tried out. I hope to update this post as I play around.
Custom Logging Formats
Nginx allows us to customize the log format so that we only record the bits we care about. This can save on both disk space and time to parse if done correctly.
Here’s an example from the Nginx Documentation:
http {
    log_format compression '$remote_addr - $remote_user [$time_local] '
                           '"$request" $status $body_bytes_sent '
                           '"$http_referer" "$http_user_agent" "$gzip_ratio"';
}
Report Generation
GoAccess allows for generation of reports. This can be a nice visualization such as HTML, as well as outputs to CSV and JSON for more programatic manipulation.
Here’s a JSON report for the GoAccess website itself:
"general": {
    "date_time": "2016-11-22 21:48:12 -0600",
    "total_requests": 248660,
    "valid_requests": 248660,
    "failed_requests": 0,
    "generation_time": 20,
    "unique_visitors": 22953,
    "unique_files": 14622,
    "excluded_hits": 0,
    "unique_referrers": 5587,
    "unique_not_found": 994,
    "unique_static_files": 10521,
    "log_size": 64570946,
    "bandwidth": 3650756631,
    "log_path": "/var/log/nginx/access.log"
}
We can do many things with a JSON export of website traffic, but one of my favorite ideas is to have a “Most Popular Posts” section of my website.