Tree-based Plots in NetworkX
Published on
Updated on
Warning: This post has not been modified
for over 2 years. For technical posts,
make sure that it is still relevant.
A graph in D3 and NetworkX can be represented as a JSON file.
Example:
{
    "nodes": [
        {"id": 1, "name": "A"},
        {"id": 2, "name": "B"},
        {"id": 3, "name": "C"}
    ],
    "links": [
        {"source": 1,"target": 2},
        {"source": 1,"target": 3}
    ]
}
The nodes entry in the JSON is a list containing a node object. Each node object has a unique id and a name which can appear inside the node in the drawing.
The links entry in the JSON is a list of link objects which each denote a (directed) edge between a source and target id.
To run the following script you’ll need graphwiz installed on the system. You’ll also need to have the python packages networkx and pydot.
import networkx as nx
from networkx.readwrite import json_graph
from networkx.drawing.nx_pydot import graphviz_layout
import matplotlib.pyplot as plt

# Replace graph_json variable with JSON representation of graph
graph_json = {"nodes": [{"id": 1, "name": "A"},{"id": 2, "name": "B"}],"links": [{"source":1,"target":2}]}

node_labels = {node['id']:node['name'] for node in graph_json['nodes']}
for n in graph_json['nodes']:
    del n['name']
g = json_graph.node_link_graph(graph_json, directed=True, multigraph=False)
pos = graphviz_layout(g, prog="dot")
nx.draw(g.to_directed(), pos, labels=node_labels, with_labels=True)
plt.show()
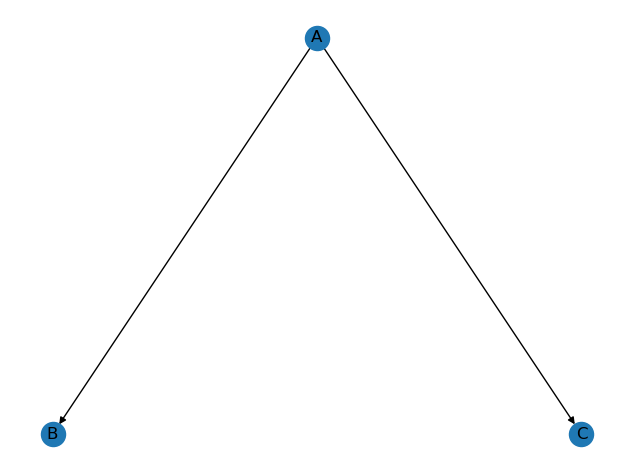
Given the JSON from the top of the post it’ll produce: